728x90
Here is the code I met previously.
#ifdef GL_ES
precision mediump float;
#endif

uniform vec2 u_resolution;
uniform vec2 u_mouse;
uniform float u_time;

// Plot a line on Y using a value between 0.0-1.0
float plot(vec2 st, float pct){
  return  smoothstep( pct-0.02, pct, st.y) -
          smoothstep( pct, pct+0.02, st.y);
}

void main() {
	vec2 st = gl_FragCoord.xy/u_resolution;

    float y = st.x; // line 22

    vec3 color = vec3(y);

    // Plot a line
    float pct = plot(st,y);
    color = (1.0-pct)*color+pct*vec3(0.0,1.0,0.0);

	gl_FragColor = vec4(color,1.0);
}
If I change the instruction in line 22 to other function value, I can see different graph, or gradiate.
// Author: Inigo Quiles
// Title: Expo

#ifdef GL_ES
precision mediump float;
#endif

#define PI 3.14159265359

uniform vec2 u_resolution;
uniform vec2 u_mouse;
uniform float u_time;

float plot(vec2 st, float pct){
  return  smoothstep( pct-0.02, pct, st.y) -
          smoothstep( pct, pct+0.02, st.y);
}

void main() {
    vec2 st = gl_FragCoord.xy/u_resolution;

    float y = pow(st.x,5.0);

    vec3 color = vec3(y);

    float pct = plot(st,y);
    color = (1.0-pct)*color+pct*vec3(0.0,1.0,0.0);

    gl_FragColor = vec4(color,1.0);
}
Like this. The function 'pow' will print the graph seems like a 'y = x5' graph.

Also with a function 'step'. As you can see, the function also affects color, of course.
#ifdef GL_ES
precision mediump float;
#endif

#define PI 3.14159265359

uniform vec2 u_resolution;
uniform float u_time;

float plot(vec2 st, float pct){
  return  smoothstep( pct-0.02, pct, st.y) -
          smoothstep( pct, pct+0.02, st.y);
}

void main() {
    vec2 st = gl_FragCoord.xy/u_resolution;

    // Step will return 0.0 unless the value is over 0.5,
    // in that case it will return 1.0
    float y = step(0.5,st.x);

    vec3 color = vec3(y);

    float pct = plot(st,y);
    color = (1.0-pct)*color+pct*vec3(0.0,1.0,0.0);

    gl_FragColor = vec4(color,1.0);
}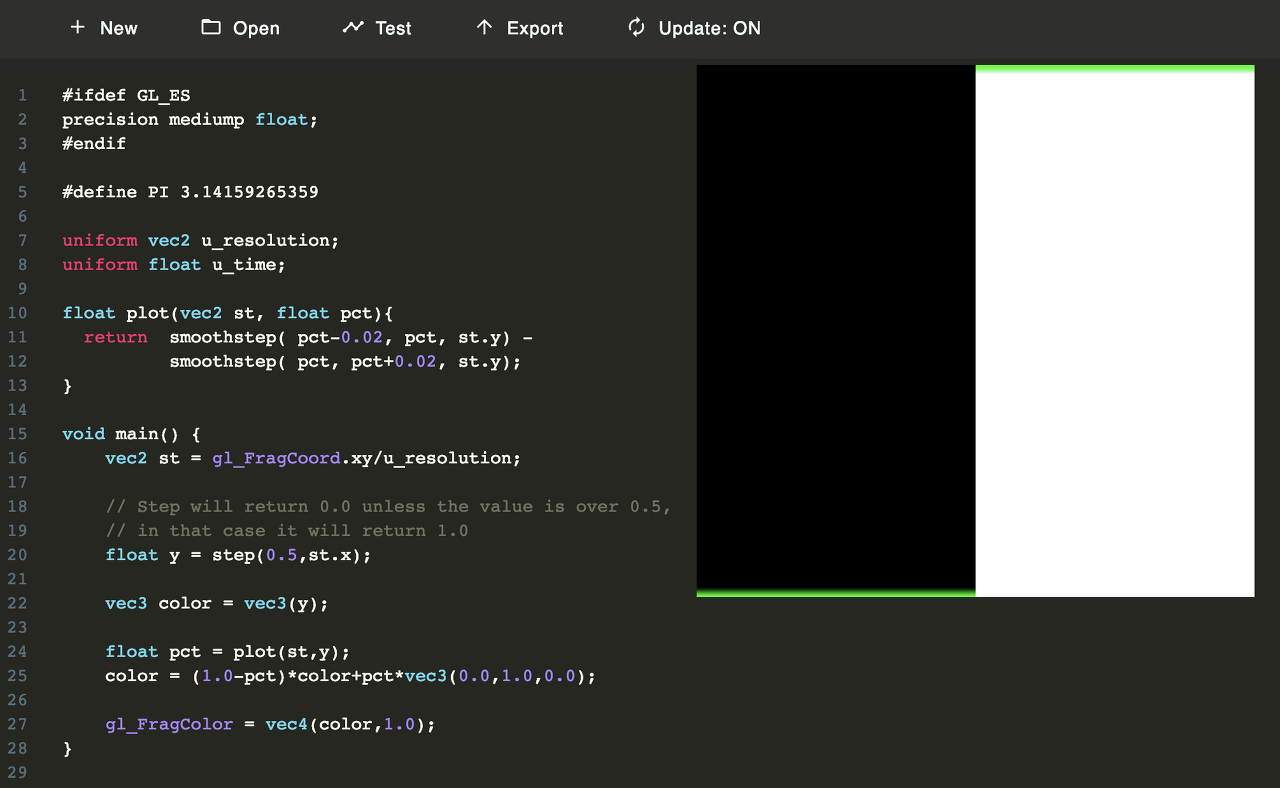
And with a function 'smoothstep'.
#ifdef GL_ES
precision mediump float;
#endif

#define PI 3.14159265359

uniform vec2 u_resolution;
uniform vec2 u_mouse;
uniform float u_time;

float plot(vec2 st, float pct){
  return  smoothstep( pct-0.02, pct, st.y) -
          smoothstep( pct, pct+0.02, st.y);
}

void main() {
    vec2 st = gl_FragCoord.xy/u_resolution;

    // Smooth interpolation between 0.1 and 0.9
    float y = smoothstep(0.1,0.9,st.x);

    vec3 color = vec3(y);

    float pct = plot(st,y);
    color = (1.0-pct)*color+pct*vec3(0.0,1.0,0.0);

    gl_FragColor = vec4(color,1.0);
}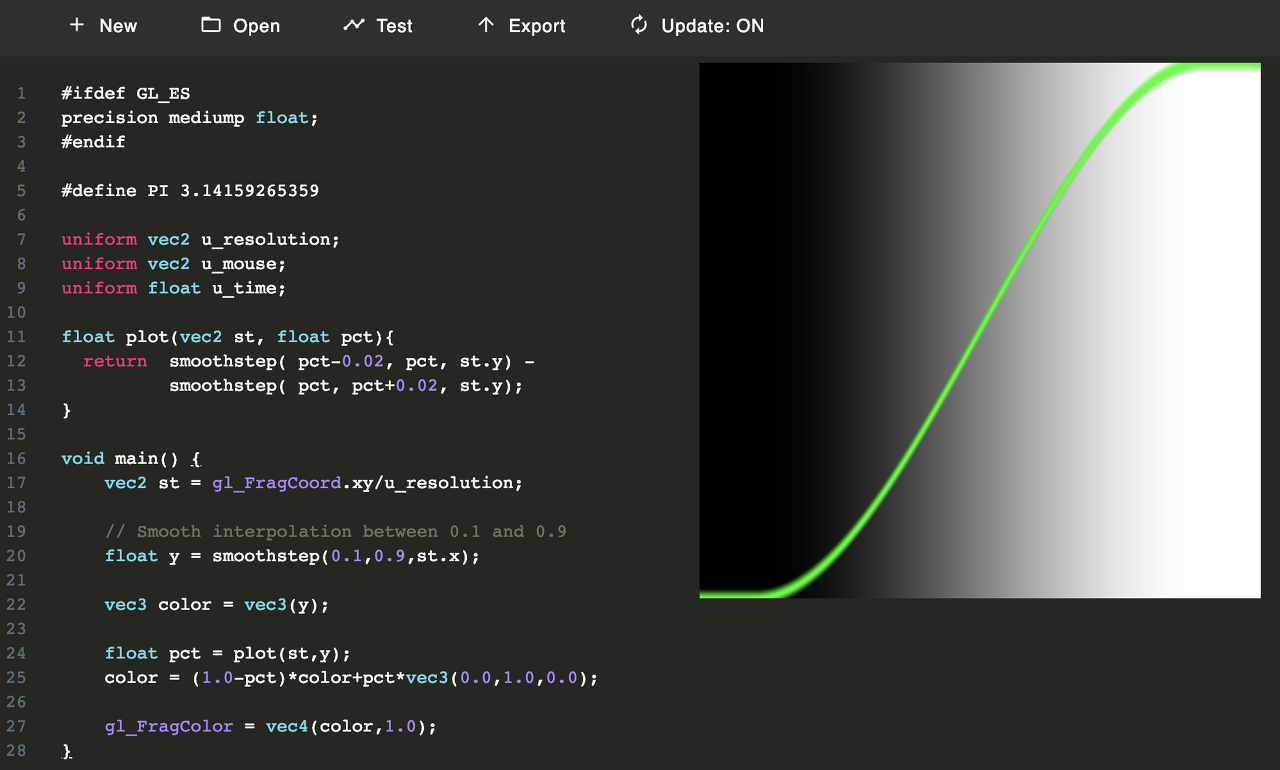
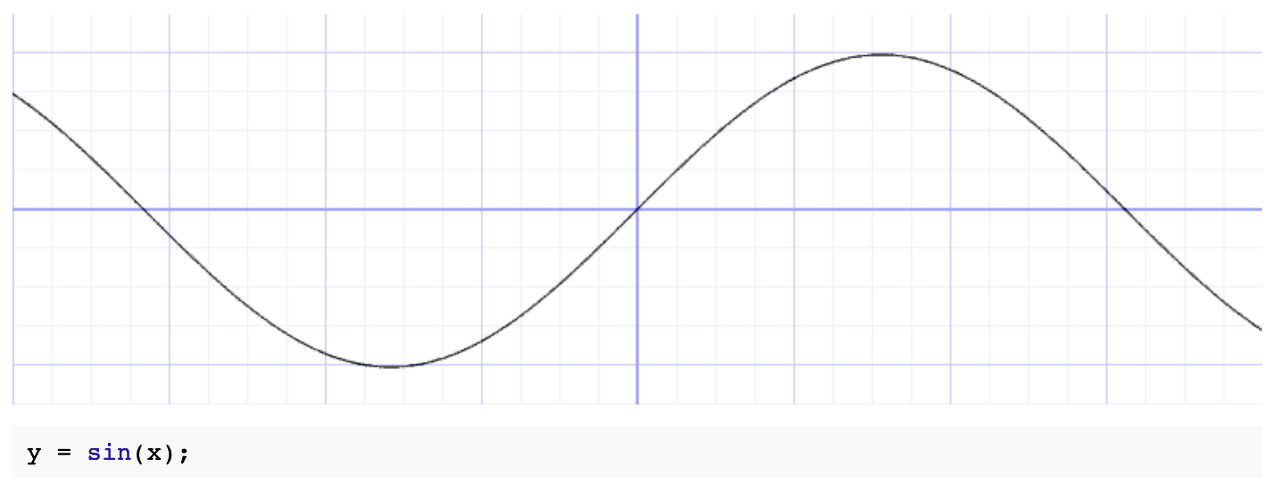
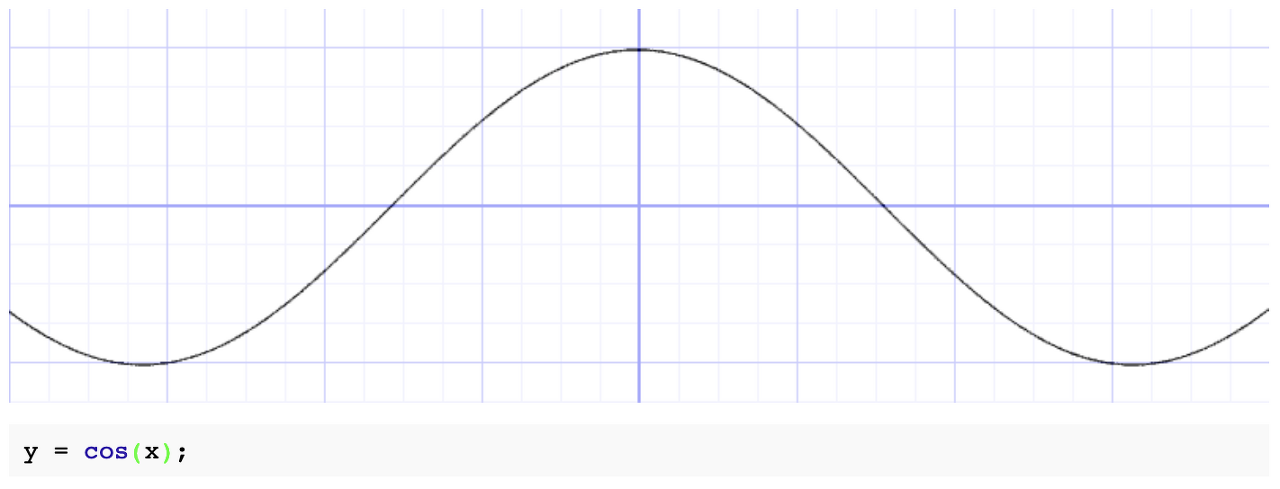
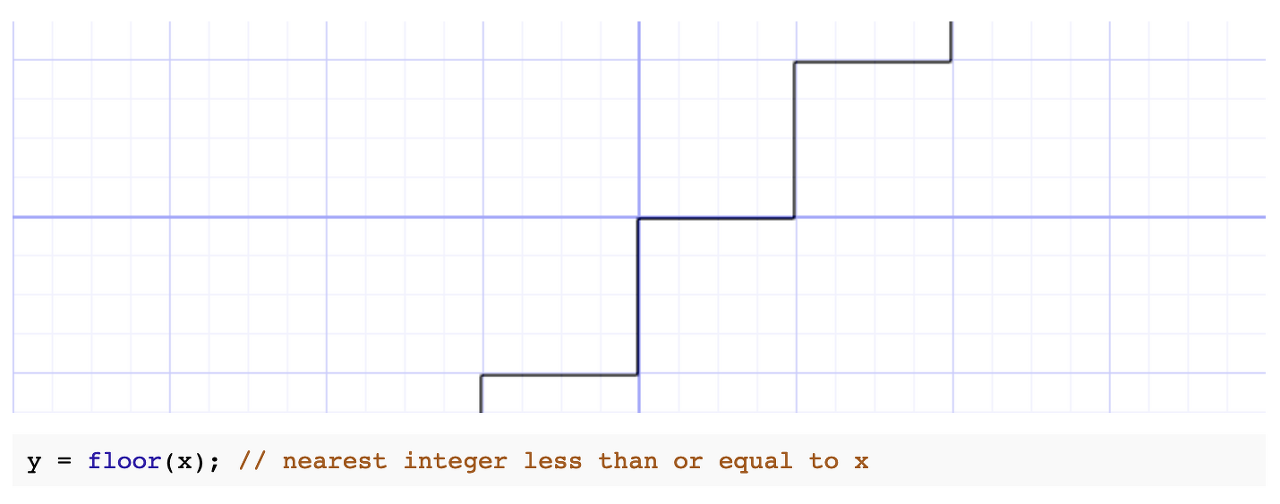
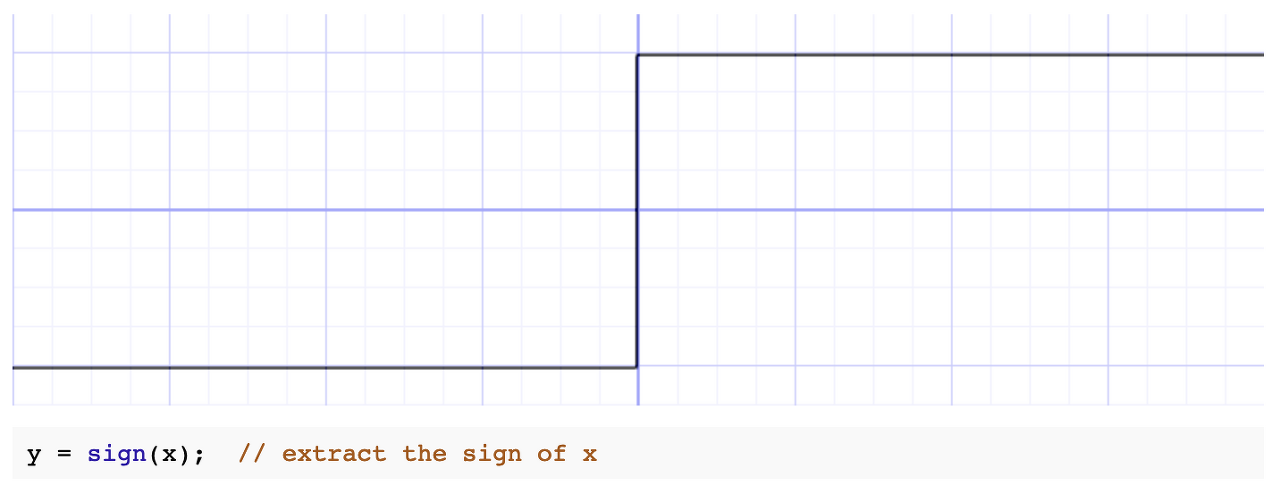
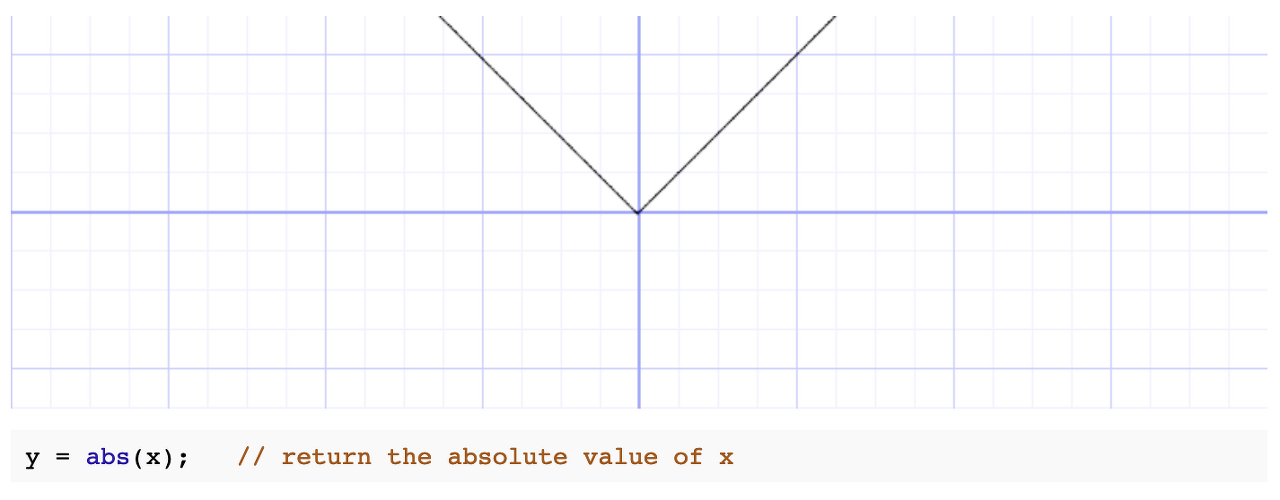
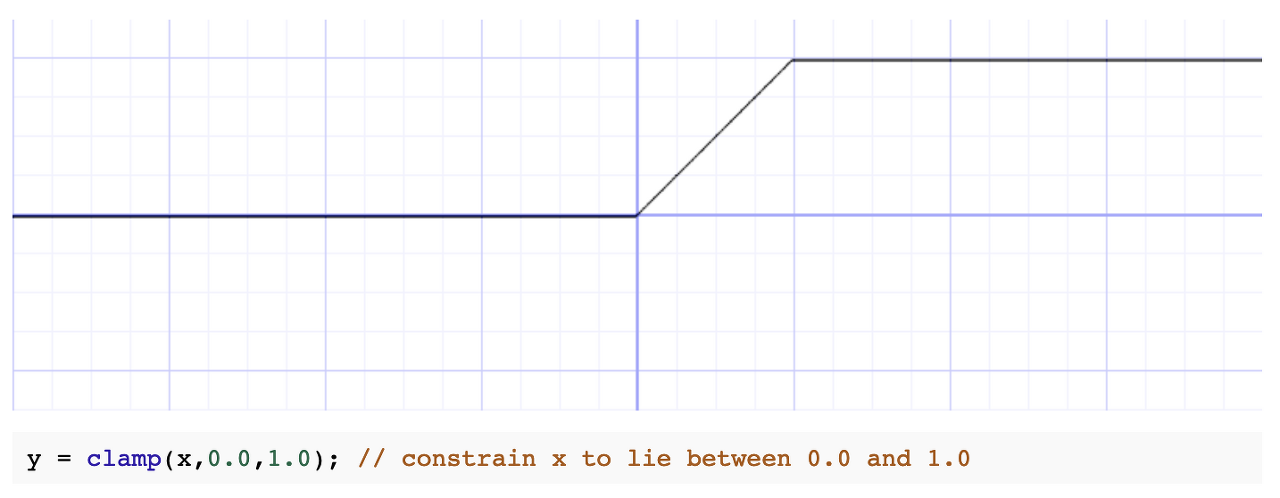
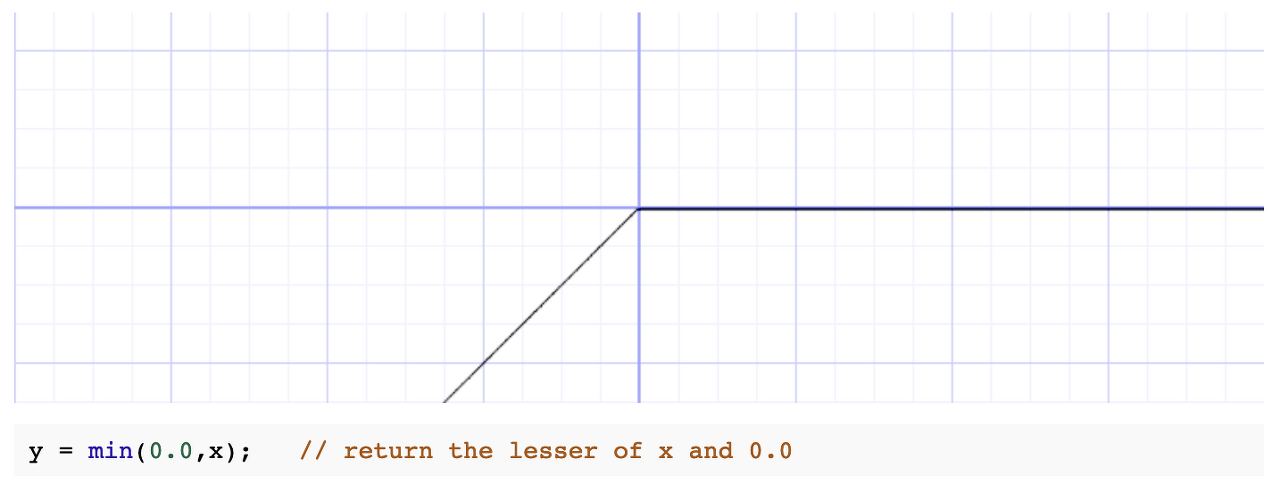
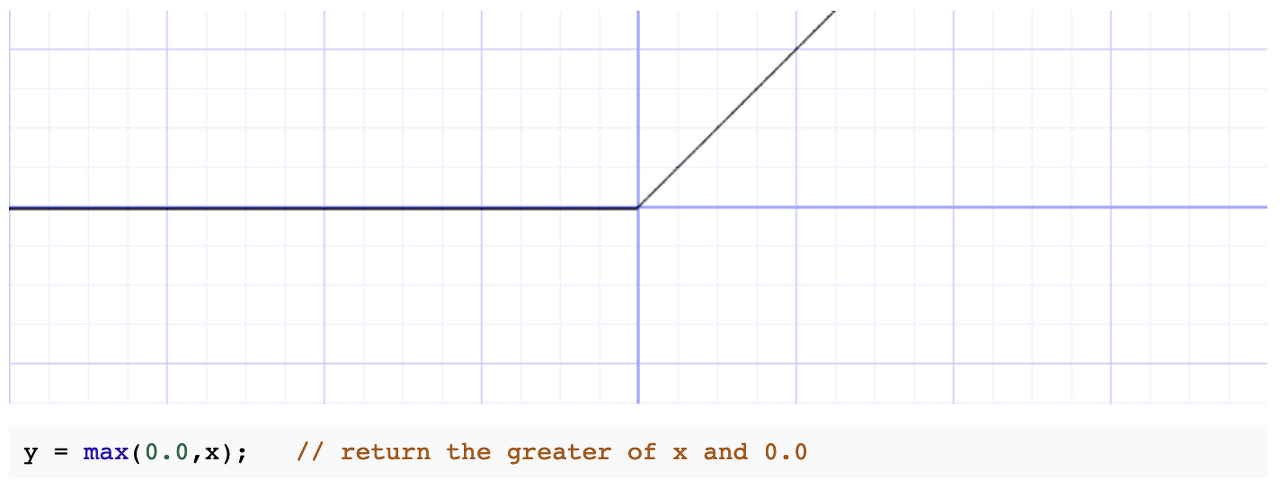
Also other functions can be used. Sine and Cosine,

728x90
'College Study > GLSL' 카테고리의 다른 글
| [GLSL] Color (0) | 2022.01.05 |
|---|---|
| [GLSL] Gain (0) | 2022.01.05 |
| [GLSL] Smoothstep (0) | 2022.01.05 |
| [GLSL] Fragment Coordinate (gl_FragCoord) (0) | 2022.01.05 |
| [GLSL] Uniform (0) | 2022.01.05 |


댓글